Welcome to PRE Stats!
I’ve gathered all the historical data which Presearch has published in its weekly podcasts and other open sources, organized it and published it in various charts and graphs here.
The Presearch team only published individual data points, generally weekly, and no historical trends. This site fixes that problem.
Also, I’ve added a lot of other open-source data, such as social network numbers, which the Presearch team doesn’t actually publish, but which is generally available.
In addition, I’ve analyzed some of that data to actually reach conclusions on what they mean: e.g., the trends in average stake per keyword, number of searches per user (the results of which are a bit disturbing), etc.
Lastly, in a couple of cases (such as social media data), there is no historical information available (through the Wayback Machine or elsewhere), so that data starts with this initial posting.
All data will be updated weekly from now on.
The site also has a blog for any comments you may have; you can also contact me directly above. Happy to receive any constructive criticism on the existing charts and graphs, as well as ideas for additional ones.
Each entry has a “stop light” rating, which gives you a quick read on whether the trends for that statistic are positive or not, as well as a brief commentary from me.
For those of you who would like to read a more detailed assessment of the Presearch project, please see my Medium post here.
Additionally, you can find my PRE Q1 2023 Quarterly Report Card here.
I have created an admin free Telegram Group found here Please Join: https://t.me/Preunchained
Hope you like it!
Alexander Makedonsky
June 2023


Comment: On June 24th, 2022, Presearch reported 4 Million plus searches per day and have since claimed that searches were, "growing steadily." In order to determine what's actually going on, we use the following formula to calculate the number of searches:

Note: The sample size for # of nodes is statistically significant and was provided by members of the community. We’ve adjusted the formula to reflect the fact that TestNet nodes receive fewer searches.

Comment: This is a really unfortunate graph. One search a day per user is really disappointing. On the other hand, this problem (as most problems do) provides an opportunity: by far, the easiest way to increase the number of searches (which would increase the value of the project to advertisers) is to encourage current users to use Presearch more. Classic low-hanging fruit!


Comment: Lower is better and we started a trend in the right direction but in general, PRE has done worse than the general market (its peers), steadily dropping in terms of market cap ranking. (In a bear market, everyone drops, so relative ranking remains unchanged.)

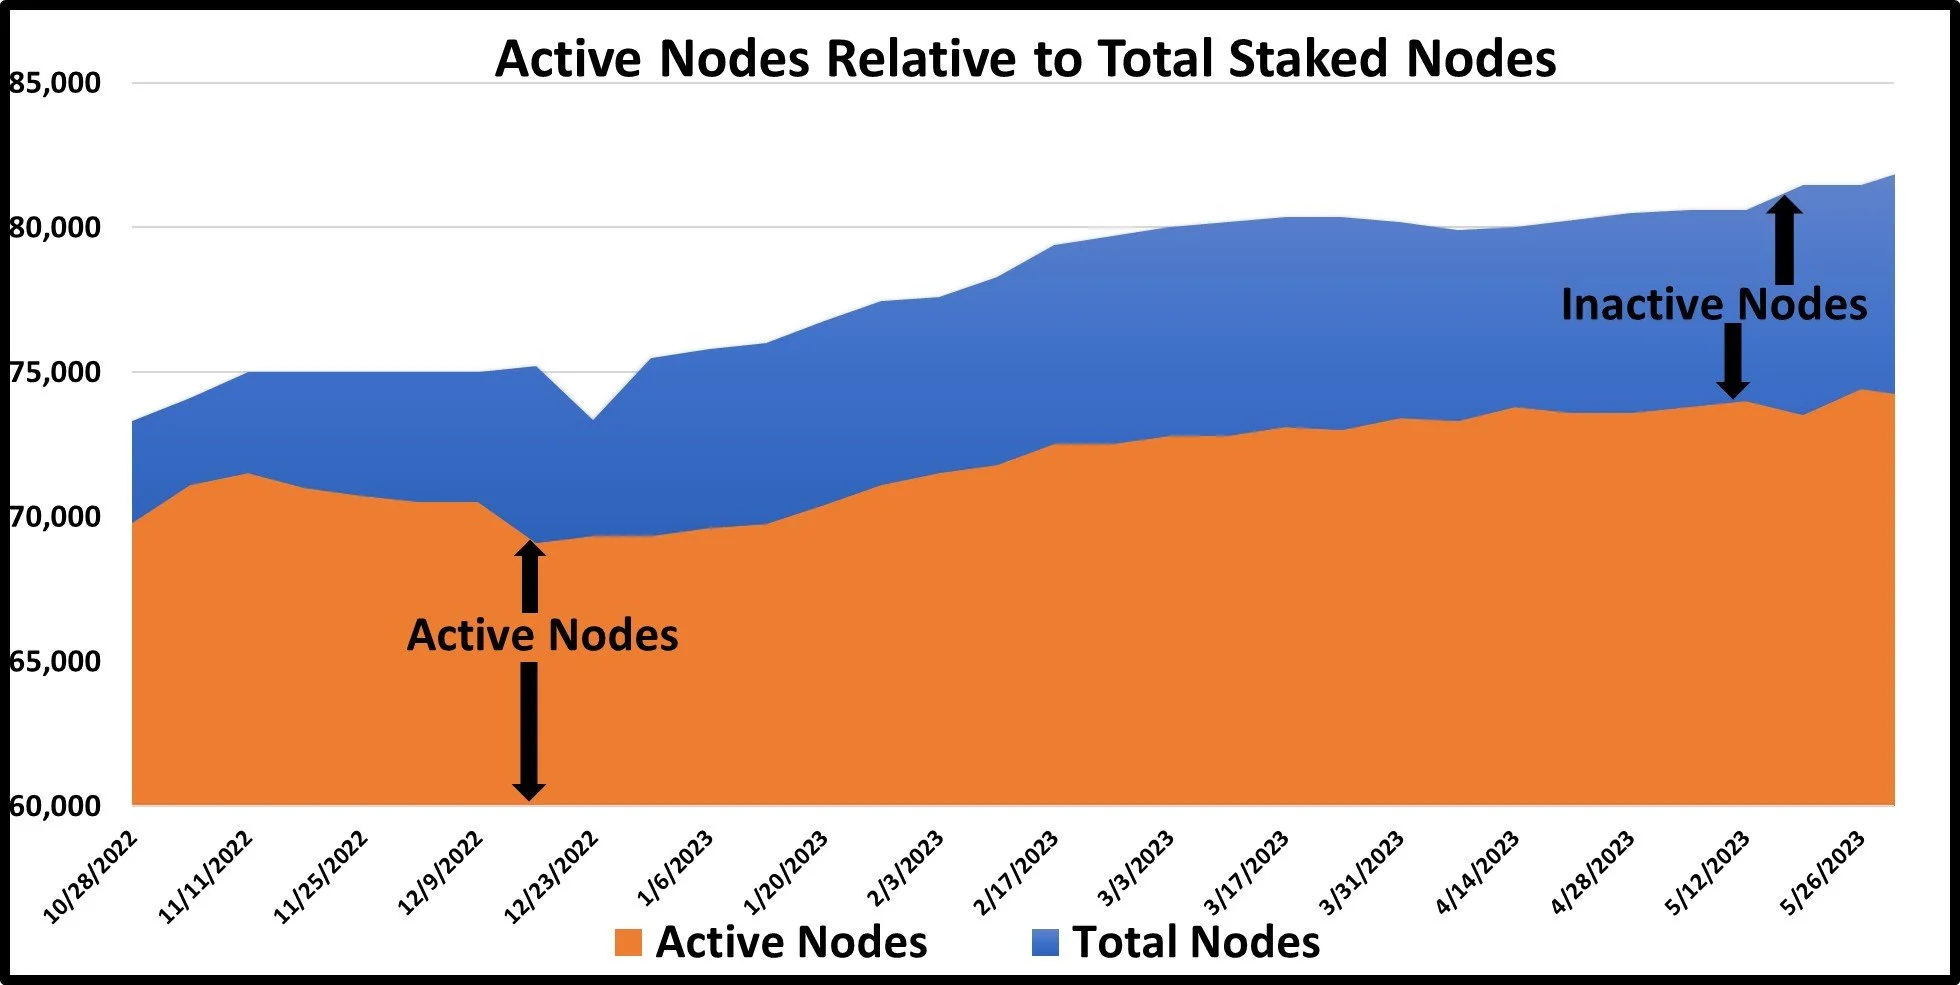
Comment: Both node staking and keyword staking. Area’s missing vertical lines indicate where data is unavailable.